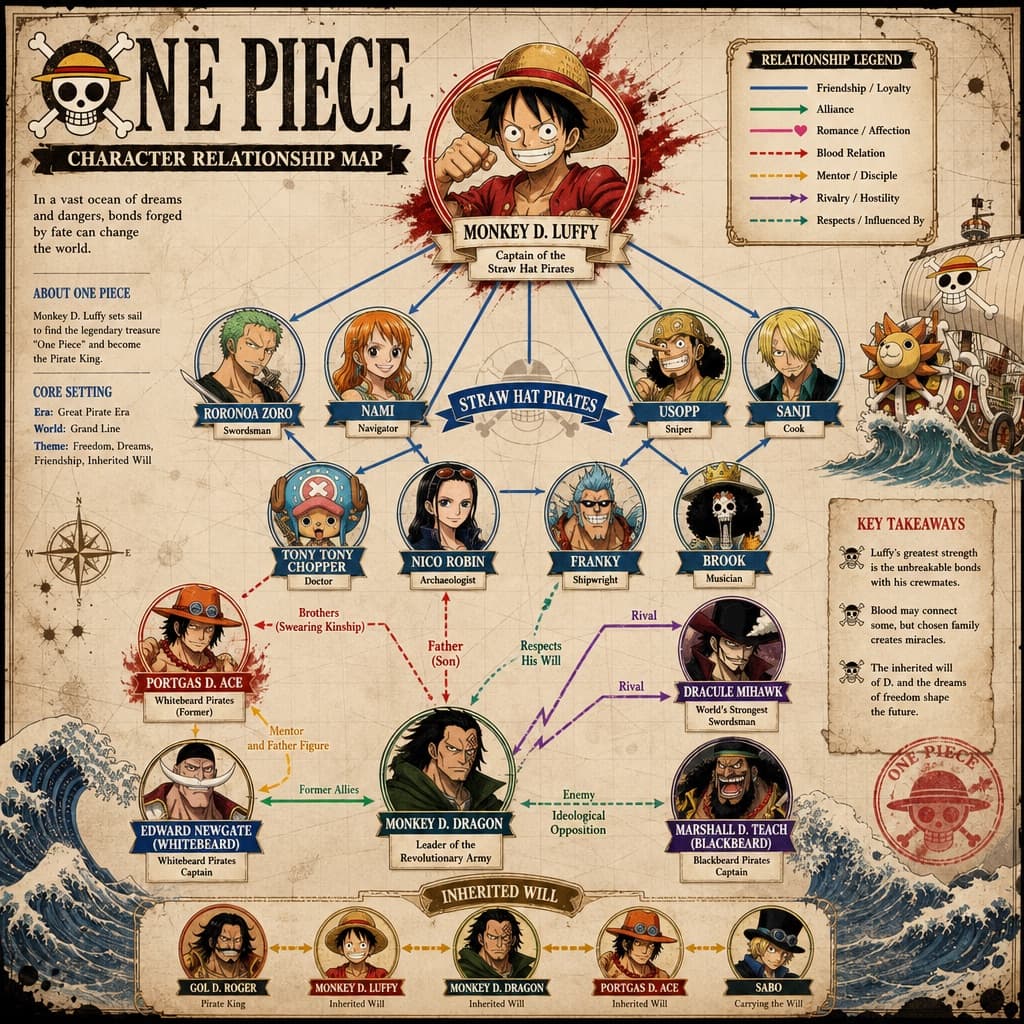
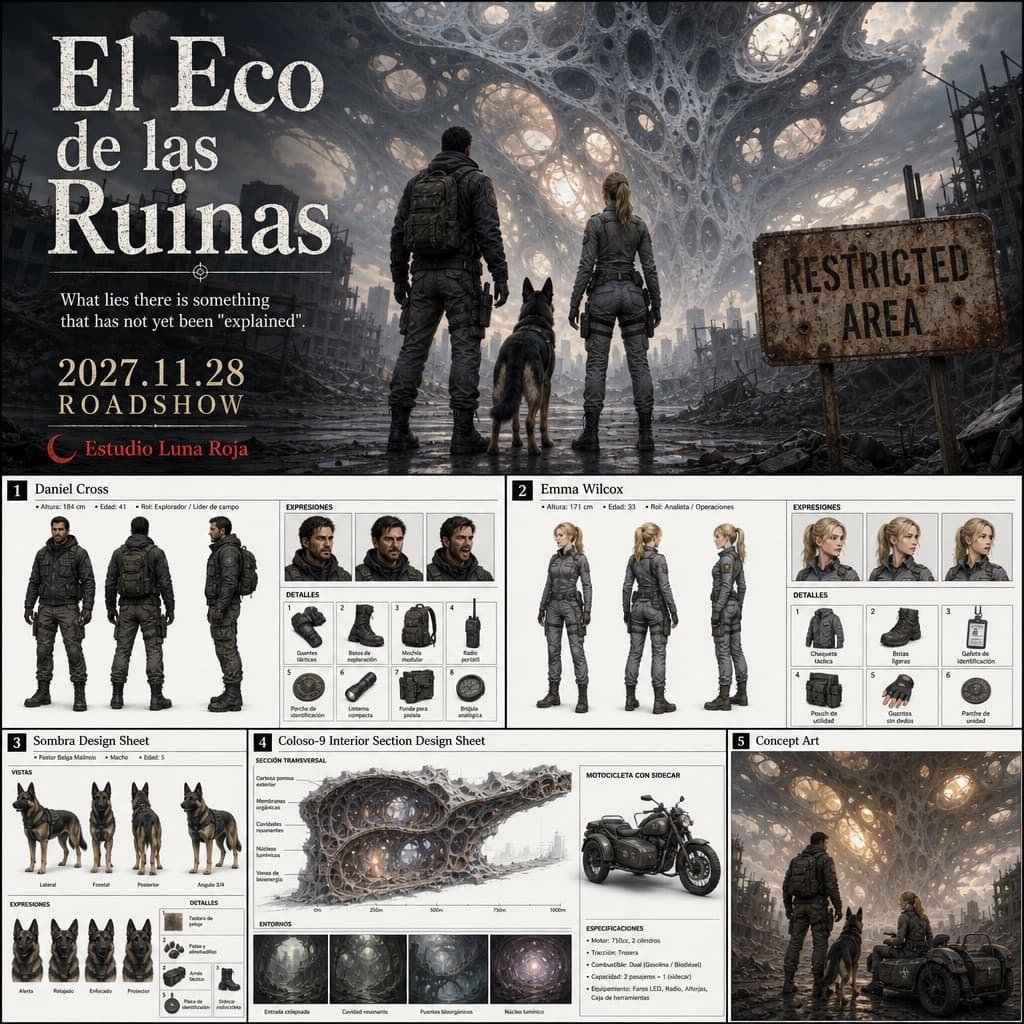
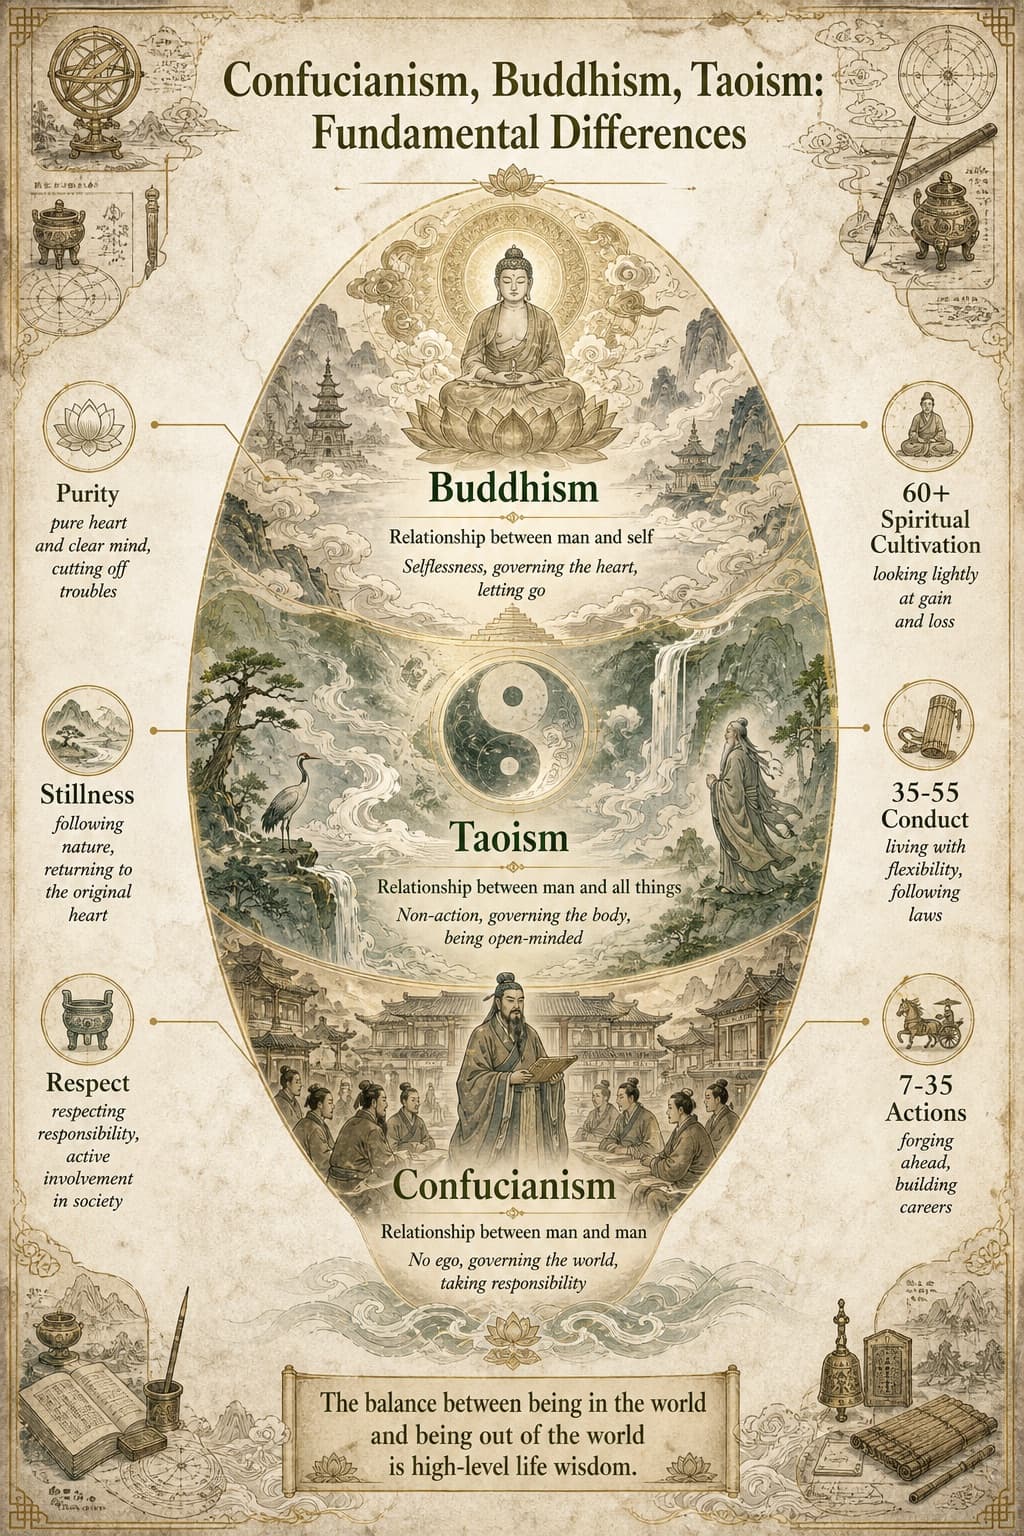
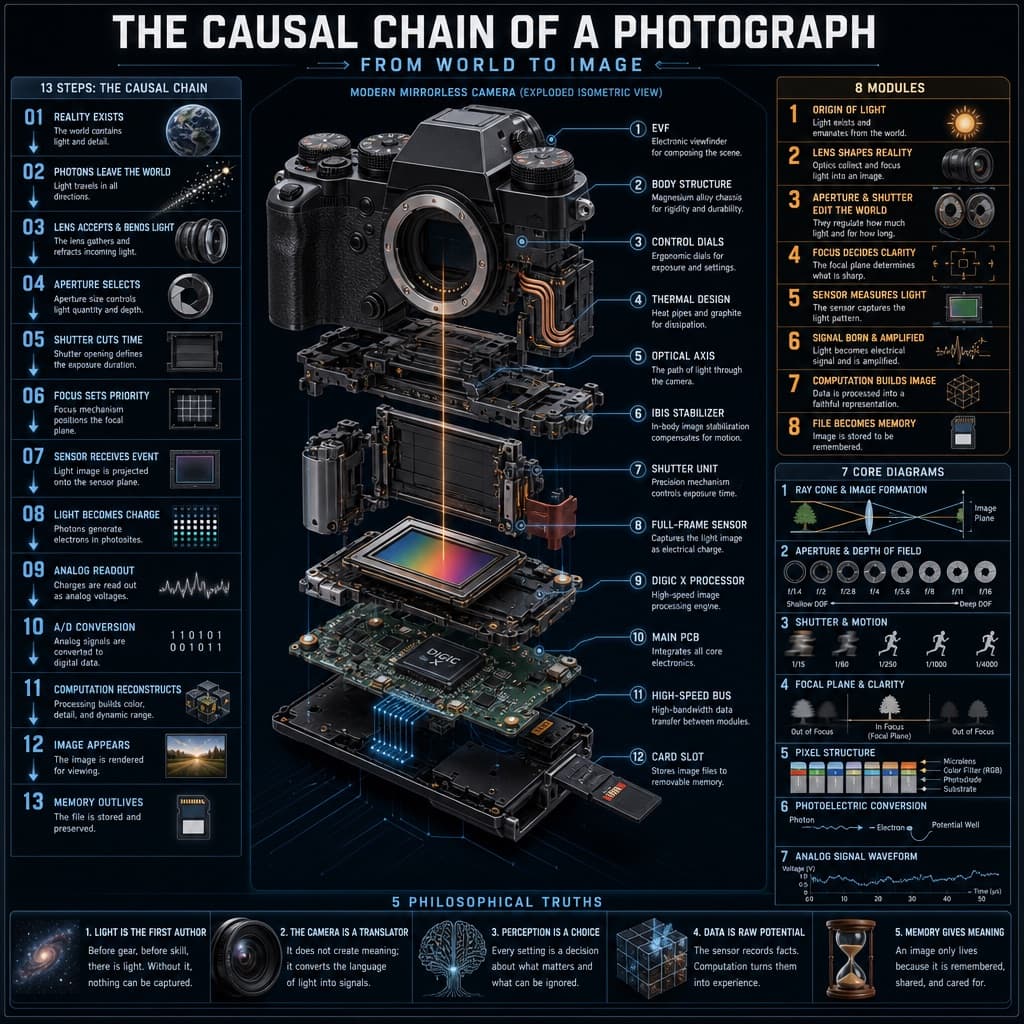
Historical Events 2x2 Infographic
A 2x2 grid infographic combining 3D diorama maps, first-person UI overlays, and period-accurate backgrounds for four historical events.
Budget models do not render typography reliably; this case needs a higher tier.
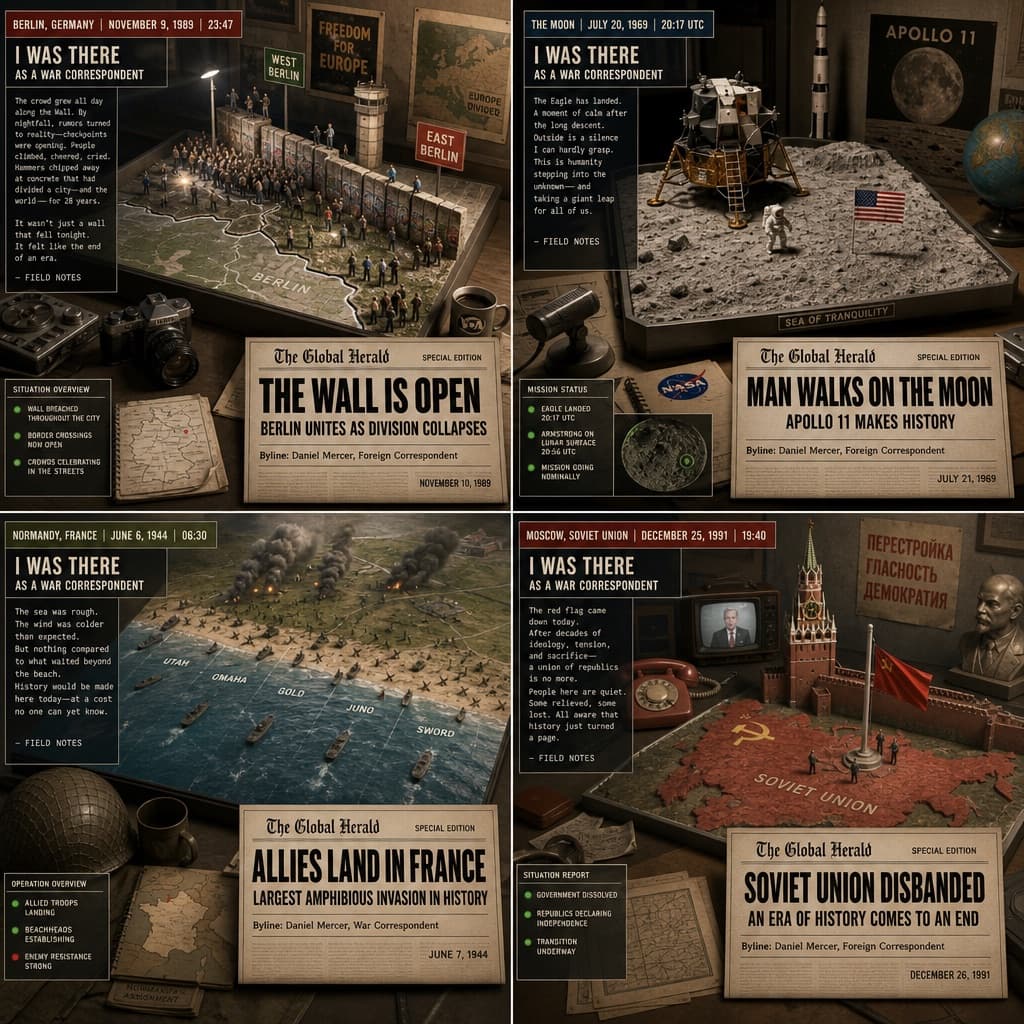
Image generated by us with gpt-image-2. Prompt by @Gdgtify
Prompt
Create a 2x2 grid layout, 16:9 aspect ratio, applying the following formula to four different famous historical events:

Render_Target =
  ( 3D_Diorama_Map_Of_[HISTORICAL_EVENT]_In_[CITY] * 1.2 )
  + ( First-Person_Account_Infographic_UI_From_The_Perspective_Of_[ROLE] * 1.5 )
  + ( Period-Accurate_Studio_Background_With_[ERA]_Artifacts * 1.0 )
  + ( Newspaper_Headline_Generator_Widget_With_Your_Byline * 0.8 )
  - ( Generic_Time_Machine_Gears_And_Clock_Dials / 3.0 )
  - ( Anachronistic_Props_From_Wrong_Decade / 2.5 )
  - ( Flat_Wikipedia_Timeline_Graphic / 2.0 )
4 placeholders still empty. Copied as is, the generator will draw the brackets literally inside the image.
Editable variables
Change any value and the prompt rewrites above. Copy the finished result.
A specific famous historical event to depict in the diorama map.
The city where the historical event took place.
The first-person perspective or role narrating the infographic account.
The historical period whose artifacts furnish the studio background.
Generate the image here
With your own OpenAI key. Free for us, and what you spend is yours.
Kept in this browser only and sent straight to OpenAI's API: it never passes through a server of ours, because there is no server of ours in between. Check it yourself in the network tab.
Fill in the remaining variables before generating, or the model will draw the brackets.