Atlas de sistemas urbanos de megaciudad
Un infográfico isométrico 3D detallado que diseca las capas ocultas de infraestructura de una megaciudad, desde el drenaje hasta el metro y la red eléctrica.
Los modelos económicos no renderizan tipografía de forma fiable; este caso necesita un nivel superior.
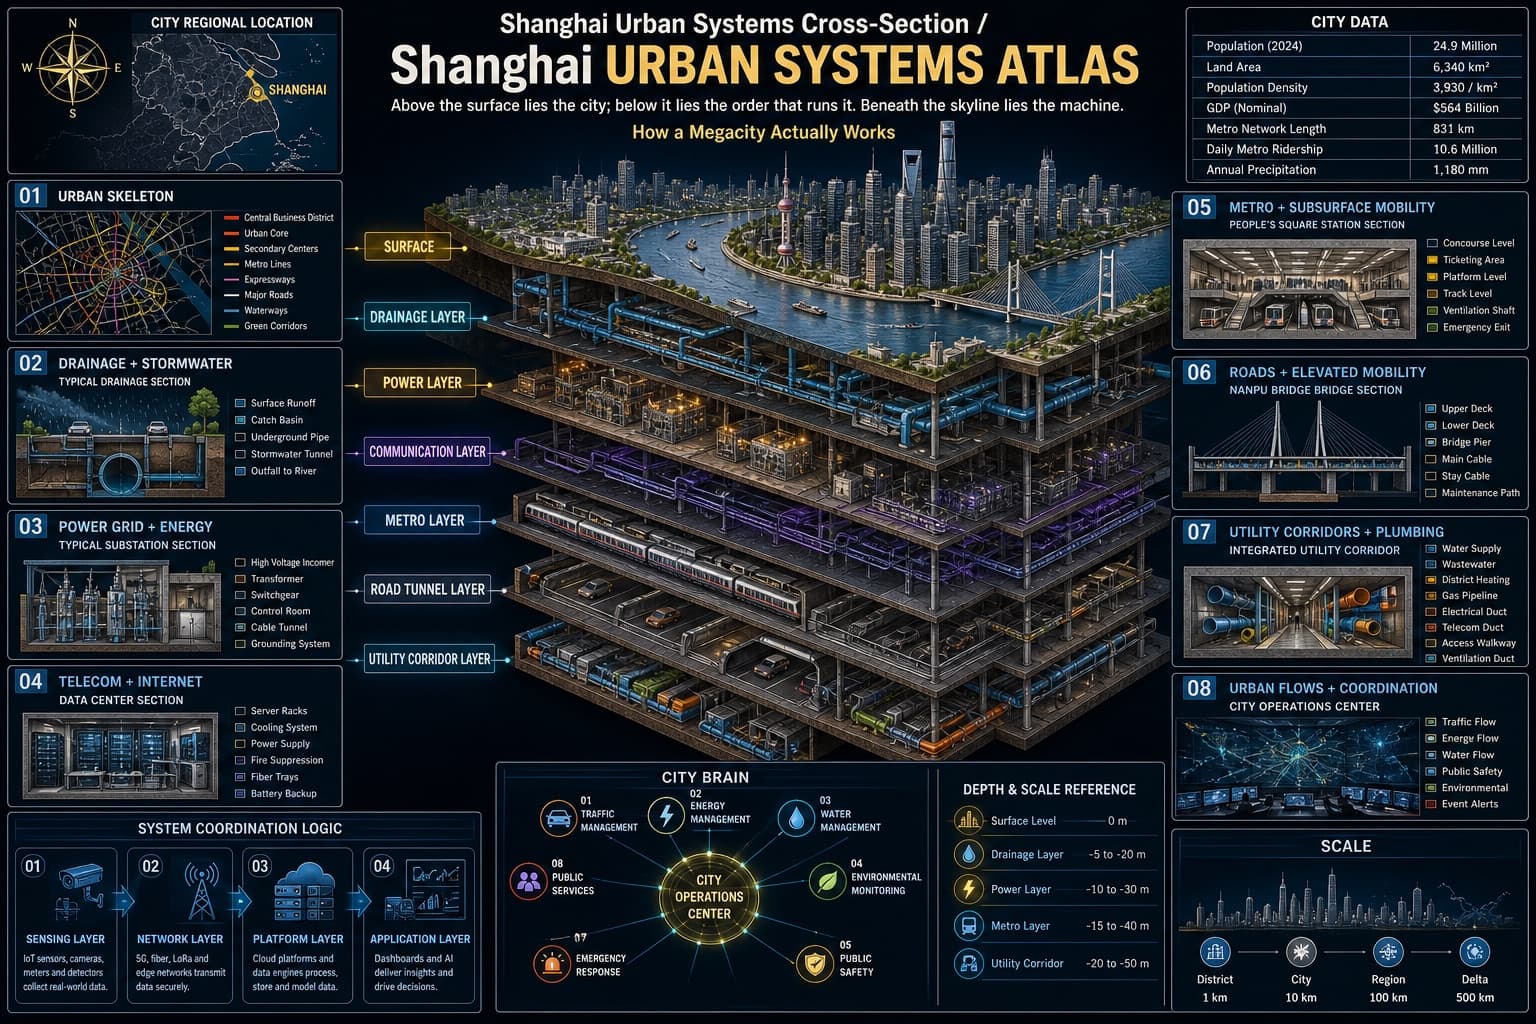
Imagen generada por nosotros con gpt-image-2. Prompt de @hx831126
Prompt
{
  "type": "complex urban systems atlas infographic",
  "style": "[COLOR_PALETTE], highly detailed technical illustration, 3D isometric cutaway",
  "header": {
    "title": "[CITY_NAME_EN] Urban Systems Cross-Section / [CITY_NAME_EN] URBAN SYSTEMS ATLAS",
    "subtitles": [
      "Above the surface lies the city; below it lies the order that runs it. [SUBTITLE_EN]",
      "How a Megacity Actually Works"
    ]
  },
  "layout": {
    "top_left": "Compass rose and city map labeled 'CITY REGIONAL LOCATION'",
    "top_right": "Data table titled 'CITY DATA' with 7 rows of statistics",
    "centerpiece": {
      "description": "[CENTERPIECE_STYLE] of a megacity river landscape",
      "layers": [
        "SURFACE",
        "DRAINAGE LAYER",
        "POWER LAYER",
        "COMMUNICATION LAYER",
        "METRO LAYER",
        "ROAD TUNNEL LAYER",
        "UTILITY CORRIDOR LAYER"
      ]
    },
    "side_panels": [
      { "id": "01", "title": "URBAN SKELETON", "elements": "Map with 8 legend items" },
      { "id": "02", "title": "DRAINAGE + STORMWATER", "elements": "Cross-section diagram 'TYPICAL DRAINAGE SECTION' with 5 legend items" },
      { "id": "03", "title": "POWER GRID + ENERGY", "elements": "Cross-section diagram 'TYPICAL SUBSTATION SECTION' with 6 legend items" },
      { "id": "04", "title": "TELECOM + INTERNET", "elements": "Cross-section diagram 'DATA CENTER SECTION' with 6 legend items" },
      { "id": "05", "title": "METRO + SUBSURFACE MOBILITY", "elements": "Cross-section diagram '[METRO_STATION_NAME] STATION SECTION' with 6 legend items" },
      { "id": "06", "title": "ROADS + ELEVATED MOBILITY", "elements": "Cross-section diagram '[BRIDGE_NAME] BRIDGE SECTION' with 6 legend items" },
      { "id": "07", "title": "UTILITY CORRIDORS + PLUMBING", "elements": "Cross-section diagram 'INTEGRATED UTILITY CORRIDOR' with 8 legend items" },
      { "id": "08", "title": "URBAN FLOWS + COORDINATION", "elements": "Map diagram 'CITY OPERATIONS CENTER' with 6 legend items" }
    ],
    "bottom_panels": {
      "system_logic": {
        "title": "SYSTEM COORDINATION LOGIC",
        "steps": 4,
        "labels": ["SENSING LAYER", "NETWORK LAYER", "PLATFORM LAYER", "APPLICATION LAYER"]
      },
      "city_brain": {
        "title": "CITY BRAIN",
        "central_node": 1,
        "peripheral_nodes": 8
      },
      "references": {
        "depth_scale": { "title": "DEPTH & SCALE REFERENCE", "icons": 5 },
        "map_scale": { "title": "SCALE", "markers": 4 }
      }
    }
  }
}
Quedan 7 huecos sin rellenar. Si copias así, el generador dibujará los corchetes tal cual dentro de la imagen.
Variables editables
Cambia cualquier valor y el prompt se reescribe arriba. Copia el resultado ya listo.
El esquema de color general usado para el fondo del infográfico y los acentos brillantes.
El nombre de la ciudad destacada escrito en inglés para el título del atlas.
La frase poética en inglés que se muestra como subtítulo bajo el título principal.
El estilo de renderizado usado para la ilustración principal en corte del centro.
El nombre de la estación de metro presentada en el diagrama de corte del transporte subterráneo.
El nombre del puente presentado en el diagrama de corte de la vía elevada.
Genera la imagen aquí
Con tu propia clave de OpenAI. Gratis para nosotros, lo que gastes es tuyo.
Se guarda solo en este navegador y va directa a la API de OpenAI: no pasa por ningún servidor nuestro, porque no hay ninguno en medio. Puedes comprobarlo en la pestaña de red del inspector.
Rellena las variables que quedan antes de generar: si no, el modelo dibujará los corchetes.