Infografía de la cadena causal de la gota
Una infografía médica detallada en 3D que mapea la cadena causal de la gota, desde el metabolismo de purinas hasta el daño articular y sistémico.
Los modelos económicos no renderizan tipografía de forma fiable; este caso necesita un nivel superior.
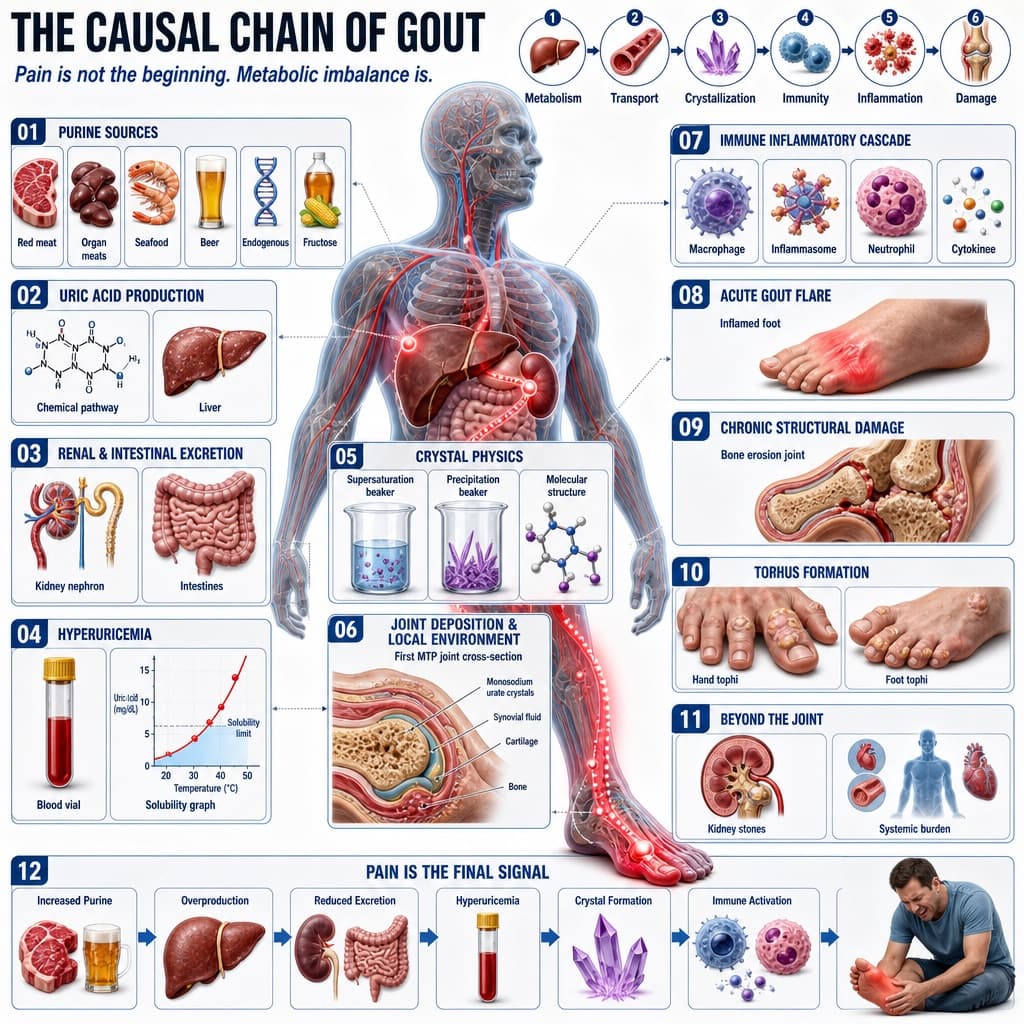
Imagen generada por nosotros con gpt-image-2. Prompt de @hx831126
Prompt
Create a comprehensive medical infographic in a highly detailed 3D medical illustration style, set against a clean clinical white background with clear, modern typography.

Header: Display the main title '[MAIN_TITLE]' in bold modern sans-serif type, with the subtitle 'Pain is not the beginning. Metabolic imbalance is.' In the top-right corner, show a sequence of six labeled stages: Metabolism, Transport, Crystallization, Immunity, Inflammation, Damage.

Centerpiece: At the center of the composition, depict [CENTRAL_FIGURE], with the pathway highlighted in [HIGHLIGHT_COLOR] descending down toward the foot.

Left column (top to bottom):
01 Purine Sources - six elements labeled Red meat, Organ meats, Seafood, Beer, Endogenous, Fructose.
02 Uric Acid Production - two elements labeled Chemical pathway, Liver.
03 Renal & Intestinal Excretion - two elements labeled Kidney nephron, Intestines.
04 Hyperuricemia - two elements labeled Blood vial, Solubility graph.

Center overlay:
05 Crystal Physics - three elements labeled Supersaturation beaker, Precipitation beaker, Molecular structure.
06 Joint Deposition & Local Environment - one element labeled First MTP joint cross-section.

Right column:
07 Immune Inflammatory Cascade - four elements labeled Macrophage, Inflammasome, Neutrophil, Cytokines.
08 Acute Gout Flare - one element labeled Inflamed foot.
09 Chronic Structural Damage - one element labeled Bone erosion joint.
10 Tophus Formation - two elements labeled Hand tophi, Foot tophi.
11 Beyond the Joint - two elements labeled Kidney stones, Systemic burden.

Bottom row:
12 Pain Is the Final Signal - seven elements labeled Increased Purine, Overproduction, Reduced Excretion, Hyperuricemia, Crystal Formation, Immune Activation, Man in pain.

Overall theme of the infographic: [DISEASE_FOCUS].
Quedan 4 huecos sin rellenar. Si copias así, el generador dibujará los corchetes tal cual dentro de la imagen.
Variables editables
Cambia cualquier valor y el prompt se reescribe arriba. Copia el resultado ya listo.
Traducción al inglés del título principal que aparece debajo del título en chino en el encabezado.
Descripción de la figura anatómica central que se muestra en el medio de la infografía.
Color utilizado para resaltar la vía fisiológica en la figura central.
La afección médica o proceso fisiológico que constituye el tema general de la infografía.
Genera la imagen aquí
Con tu propia clave de OpenAI. Gratis para nosotros, lo que gastes es tuyo.
Se guarda solo en este navegador y va directa a la API de OpenAI: no pasa por ningún servidor nuestro, porque no hay ninguno en medio. Puedes comprobarlo en la pestaña de red del inspector.
Rellena las variables que quedan antes de generar: si no, el modelo dibujará los corchetes.