Megacity Urban Systems Atlas
A detailed 3D isometric infographic dissecting a megacity's hidden infrastructure layers, from drainage to metro to power grids.
Budget models do not render typography reliably; this case needs a higher tier.
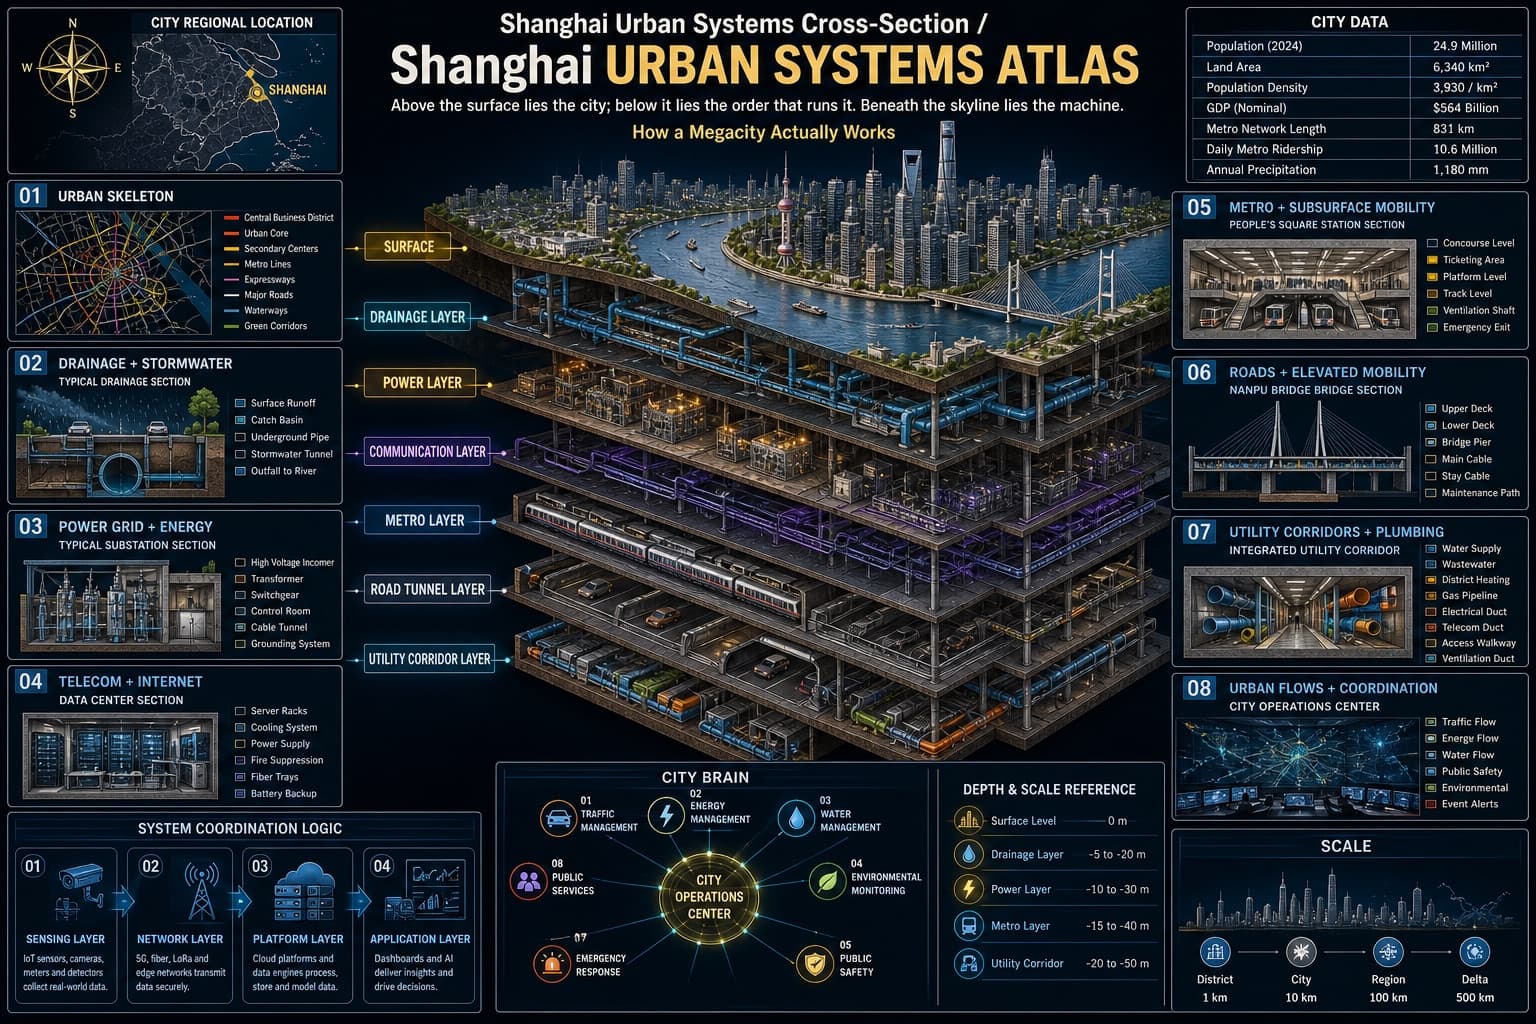
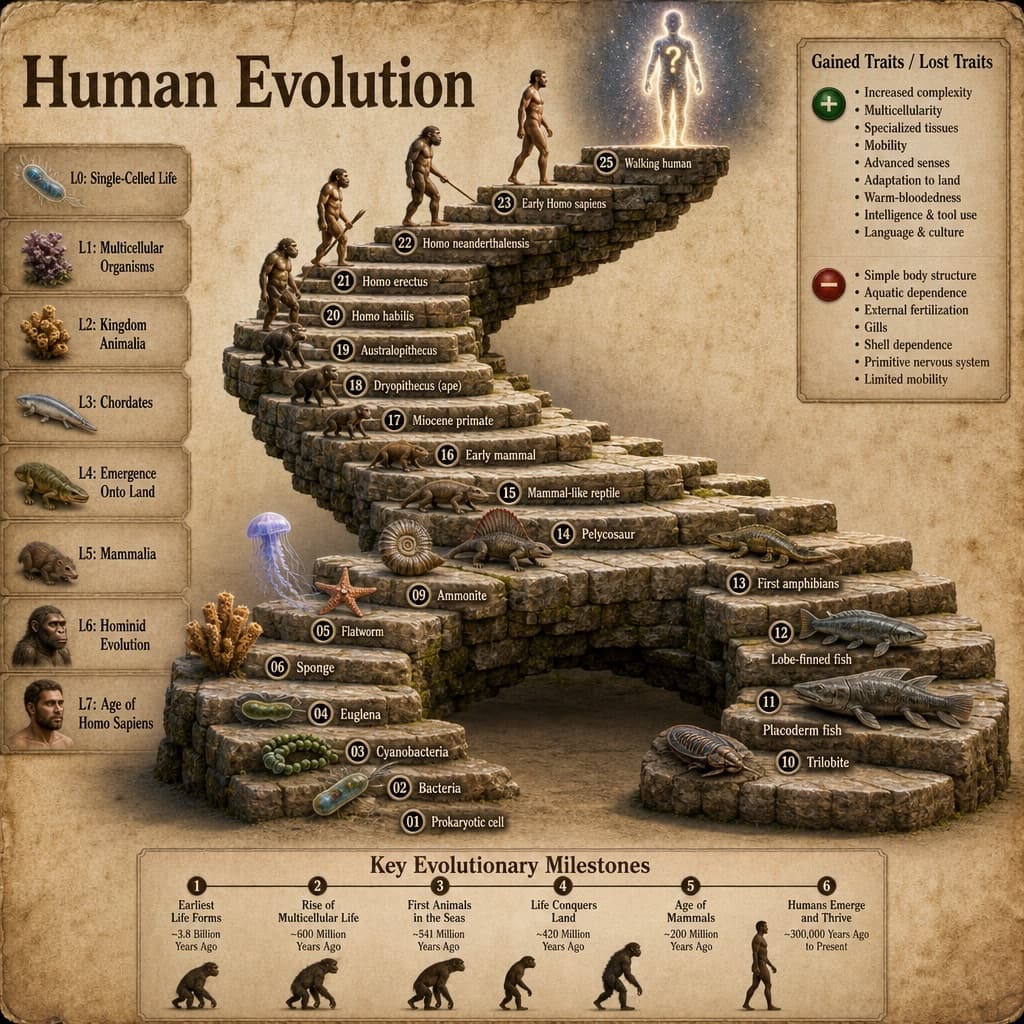
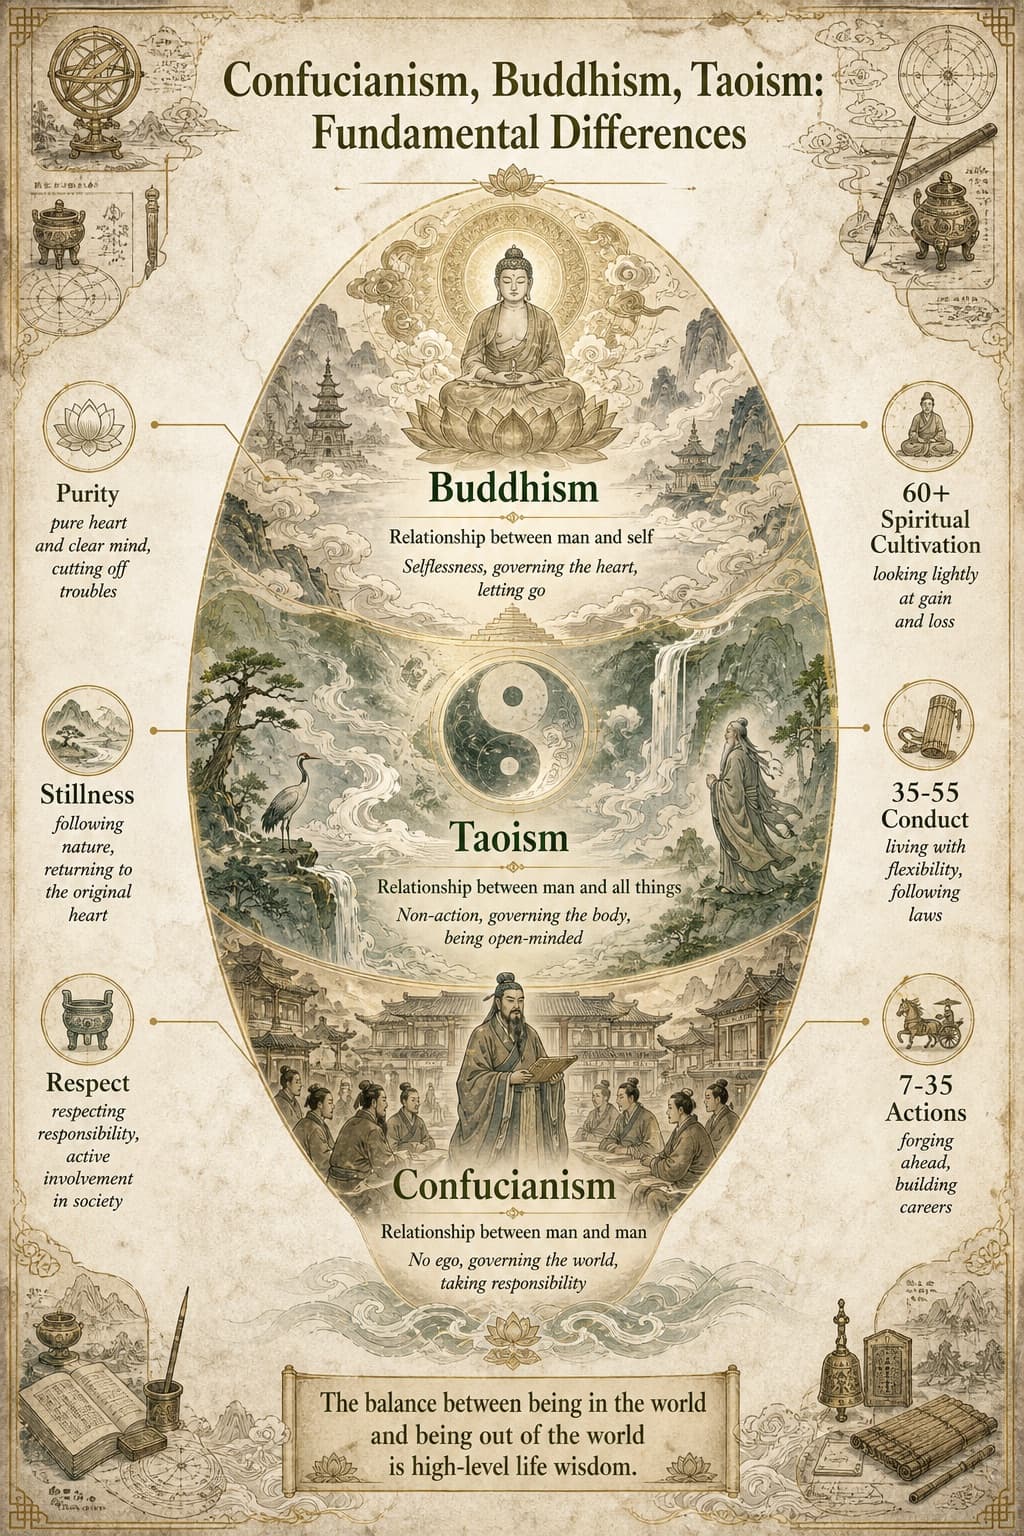
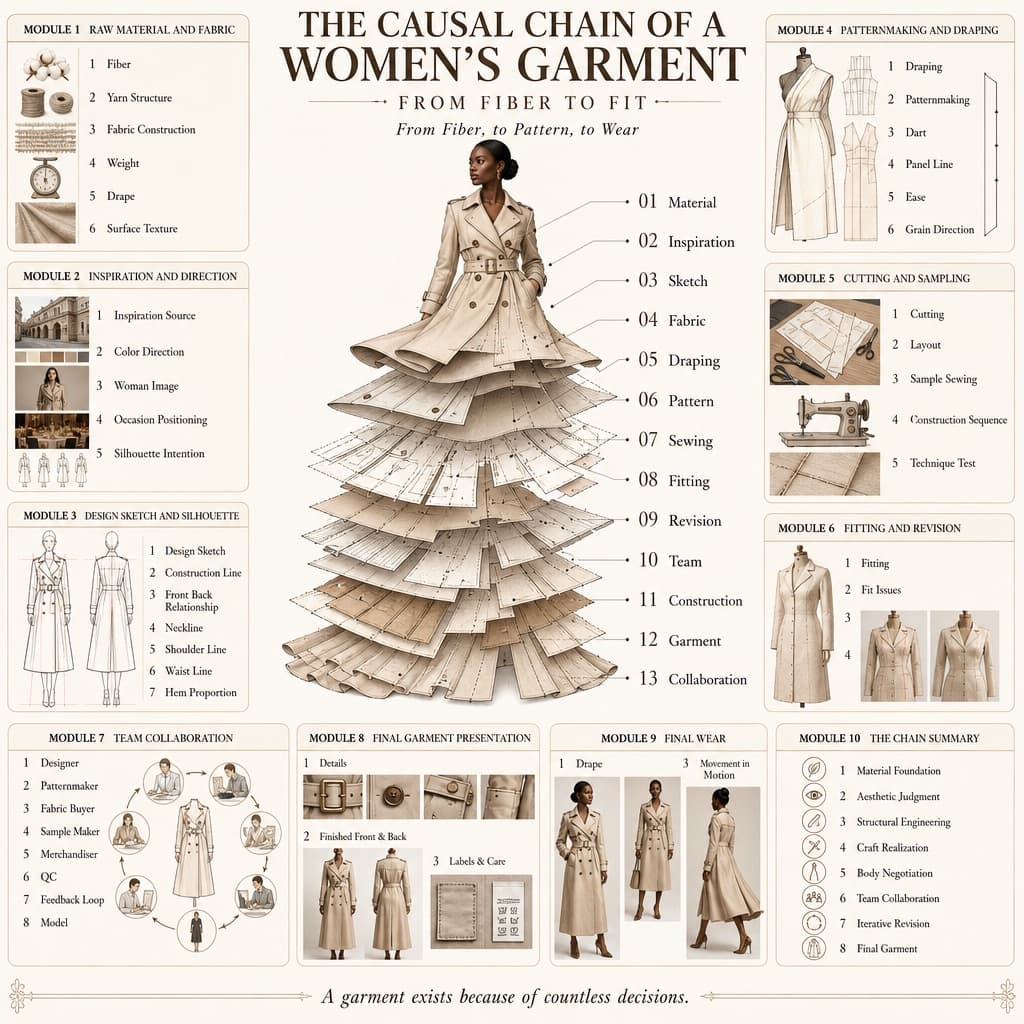
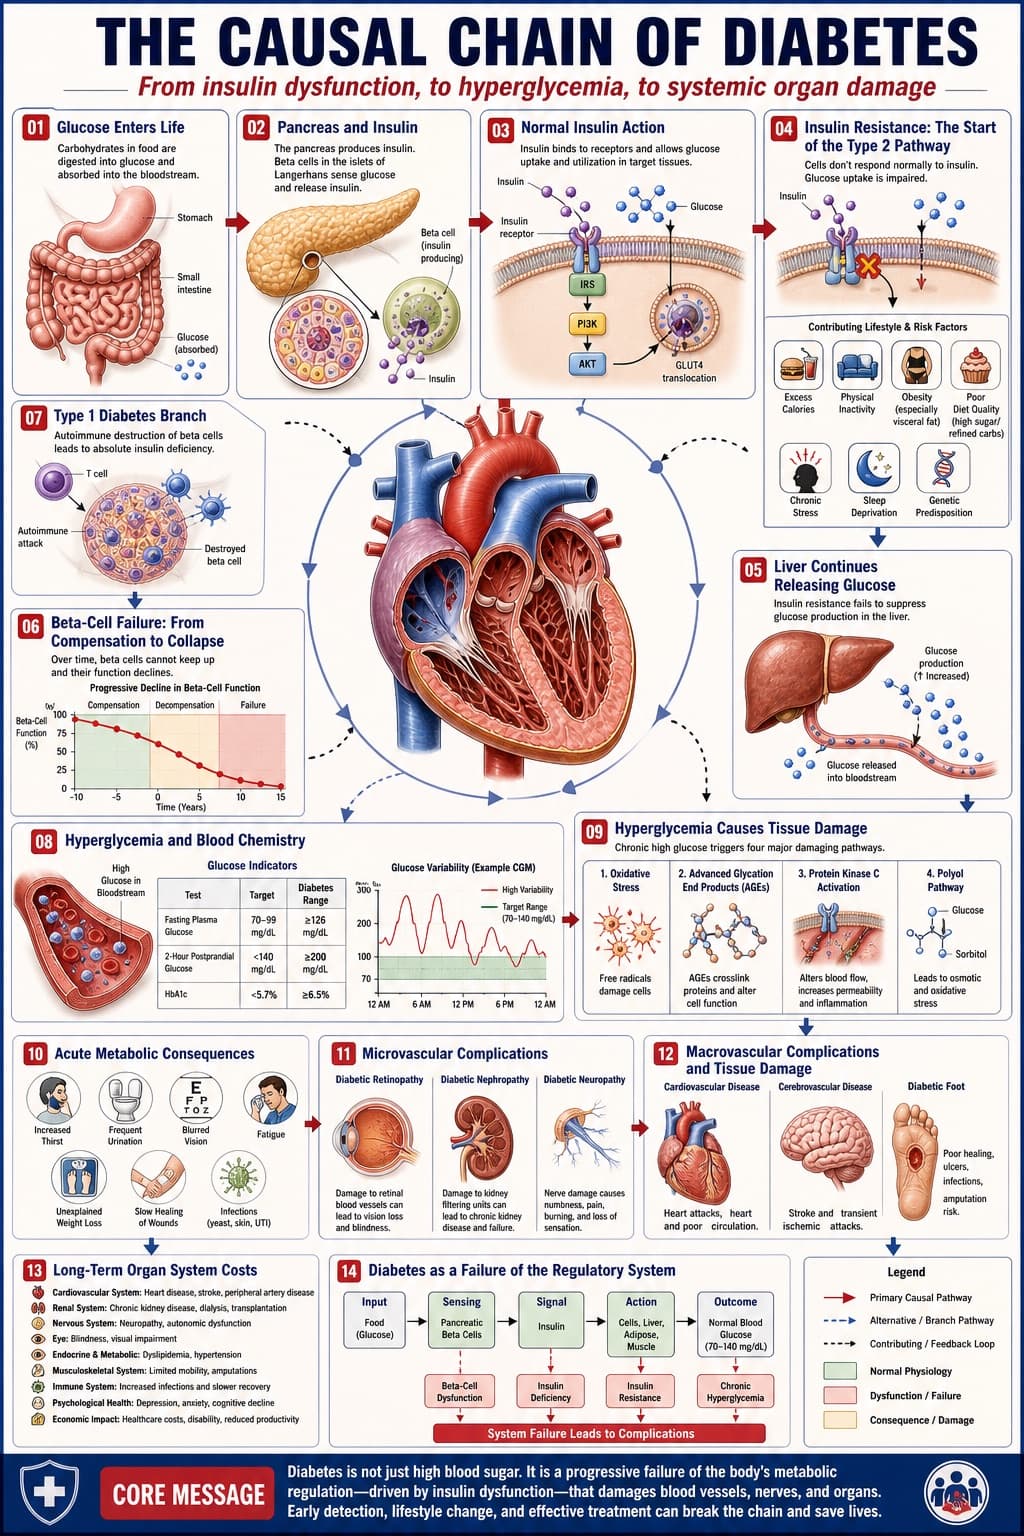
Image generated by us with gpt-image-2. Prompt by @hx831126
Prompt
{
  "type": "complex urban systems atlas infographic",
  "style": "[COLOR_PALETTE], highly detailed technical illustration, 3D isometric cutaway",
  "header": {
    "title": "[CITY_NAME_EN] Urban Systems Cross-Section / [CITY_NAME_EN] URBAN SYSTEMS ATLAS",
    "subtitles": [
      "Above the surface lies the city; below it lies the order that runs it. [SUBTITLE_EN]",
      "How a Megacity Actually Works"
    ]
  },
  "layout": {
    "top_left": "Compass rose and city map labeled 'CITY REGIONAL LOCATION'",
    "top_right": "Data table titled 'CITY DATA' with 7 rows of statistics",
    "centerpiece": {
      "description": "[CENTERPIECE_STYLE] of a megacity river landscape",
      "layers": [
        "SURFACE",
        "DRAINAGE LAYER",
        "POWER LAYER",
        "COMMUNICATION LAYER",
        "METRO LAYER",
        "ROAD TUNNEL LAYER",
        "UTILITY CORRIDOR LAYER"
      ]
    },
    "side_panels": [
      { "id": "01", "title": "URBAN SKELETON", "elements": "Map with 8 legend items" },
      { "id": "02", "title": "DRAINAGE + STORMWATER", "elements": "Cross-section diagram 'TYPICAL DRAINAGE SECTION' with 5 legend items" },
      { "id": "03", "title": "POWER GRID + ENERGY", "elements": "Cross-section diagram 'TYPICAL SUBSTATION SECTION' with 6 legend items" },
      { "id": "04", "title": "TELECOM + INTERNET", "elements": "Cross-section diagram 'DATA CENTER SECTION' with 6 legend items" },
      { "id": "05", "title": "METRO + SUBSURFACE MOBILITY", "elements": "Cross-section diagram '[METRO_STATION_NAME] STATION SECTION' with 6 legend items" },
      { "id": "06", "title": "ROADS + ELEVATED MOBILITY", "elements": "Cross-section diagram '[BRIDGE_NAME] BRIDGE SECTION' with 6 legend items" },
      { "id": "07", "title": "UTILITY CORRIDORS + PLUMBING", "elements": "Cross-section diagram 'INTEGRATED UTILITY CORRIDOR' with 8 legend items" },
      { "id": "08", "title": "URBAN FLOWS + COORDINATION", "elements": "Map diagram 'CITY OPERATIONS CENTER' with 6 legend items" }
    ],
    "bottom_panels": {
      "system_logic": {
        "title": "SYSTEM COORDINATION LOGIC",
        "steps": 4,
        "labels": ["SENSING LAYER", "NETWORK LAYER", "PLATFORM LAYER", "APPLICATION LAYER"]
      },
      "city_brain": {
        "title": "CITY BRAIN",
        "central_node": 1,
        "peripheral_nodes": 8
      },
      "references": {
        "depth_scale": { "title": "DEPTH & SCALE REFERENCE", "icons": 5 },
        "map_scale": { "title": "SCALE", "markers": 4 }
      }
    }
  }
}
7 placeholders still empty. Copied as is, the generator will draw the brackets literally inside the image.
Editable variables
Change any value and the prompt rewrites above. Copy the finished result.
The overall color scheme used for the infographic background and glowing accents.
The name of the featured city written in English for the atlas title.
The poetic English subtitle phrase displayed beneath the main title.
The rendering style used for the main centerpiece cutaway illustration.
The name of the metro station featured in the subsurface transit cross-section diagram.
The name of the bridge featured in the elevated road cross-section diagram.
Generate the image here
With your own OpenAI key. Free for us, and what you spend is yours.
Kept in this browser only and sent straight to OpenAI's API: it never passes through a server of ours, because there is no server of ours in between. Check it yourself in the network tab.
Fill in the remaining variables before generating, or the model will draw the brackets.