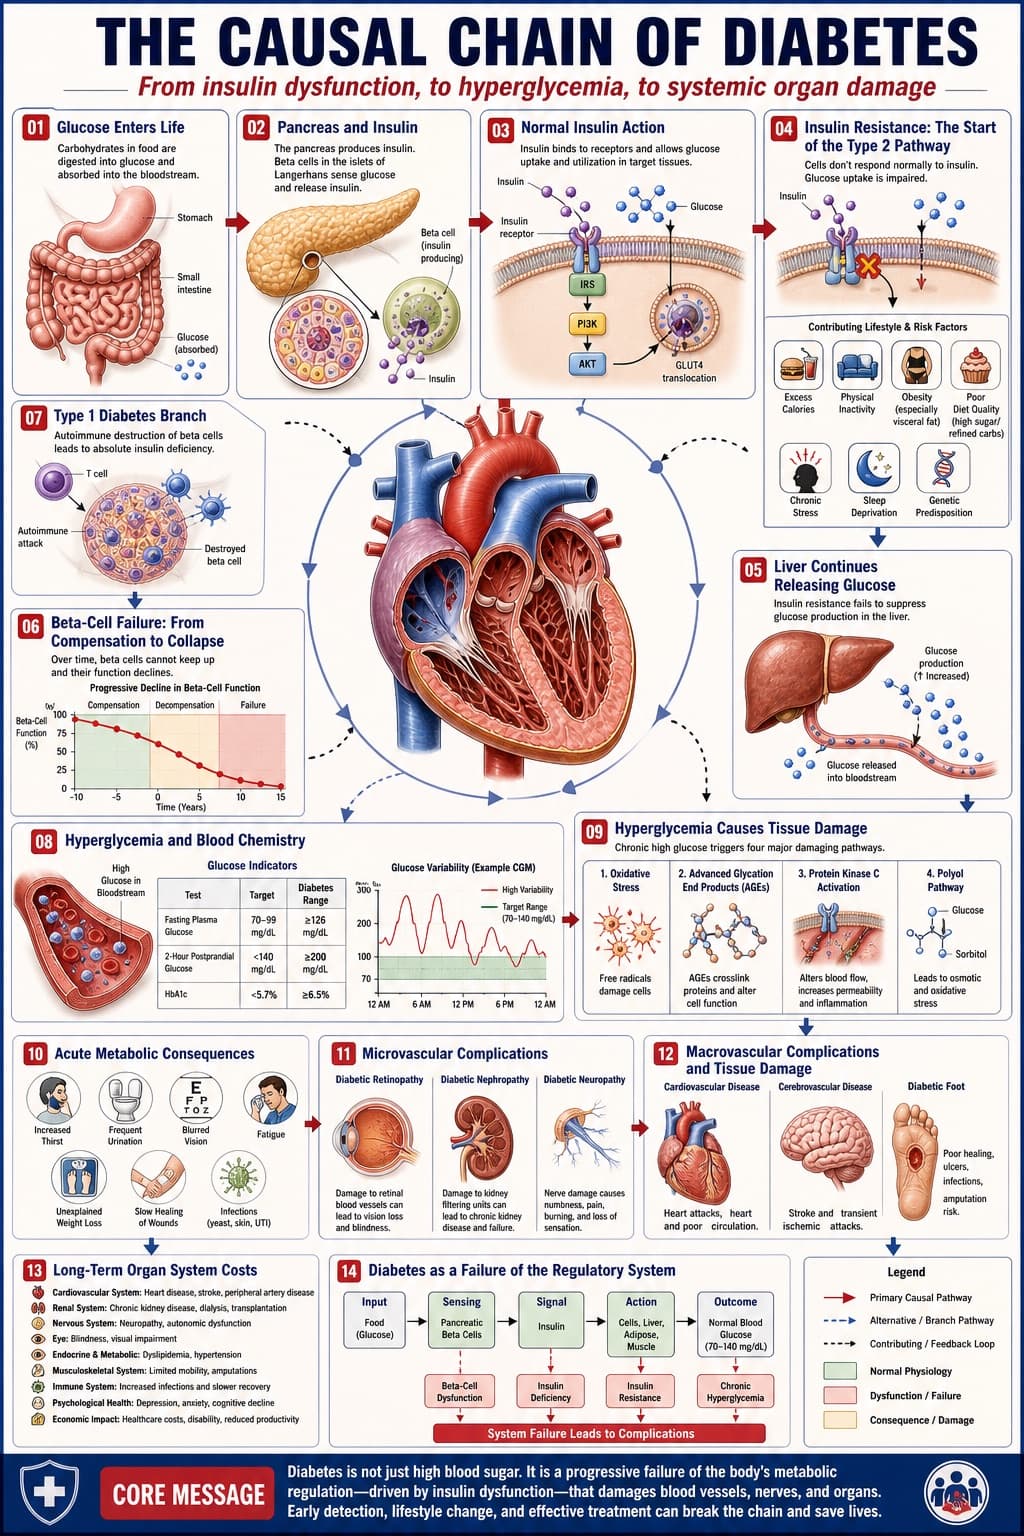
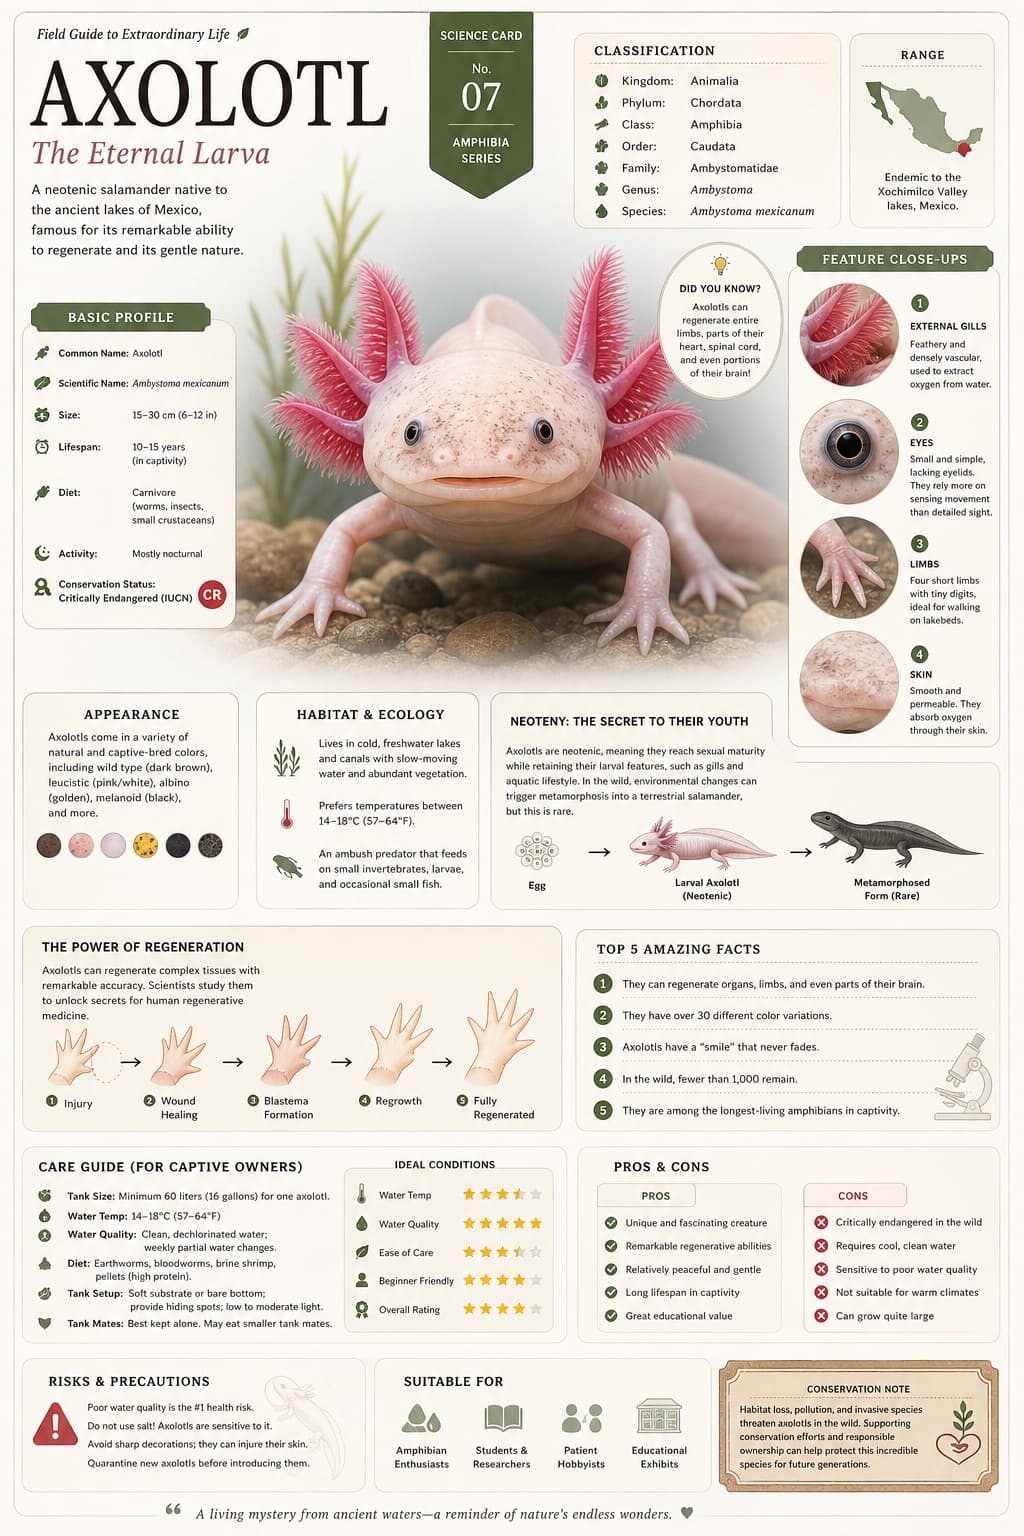
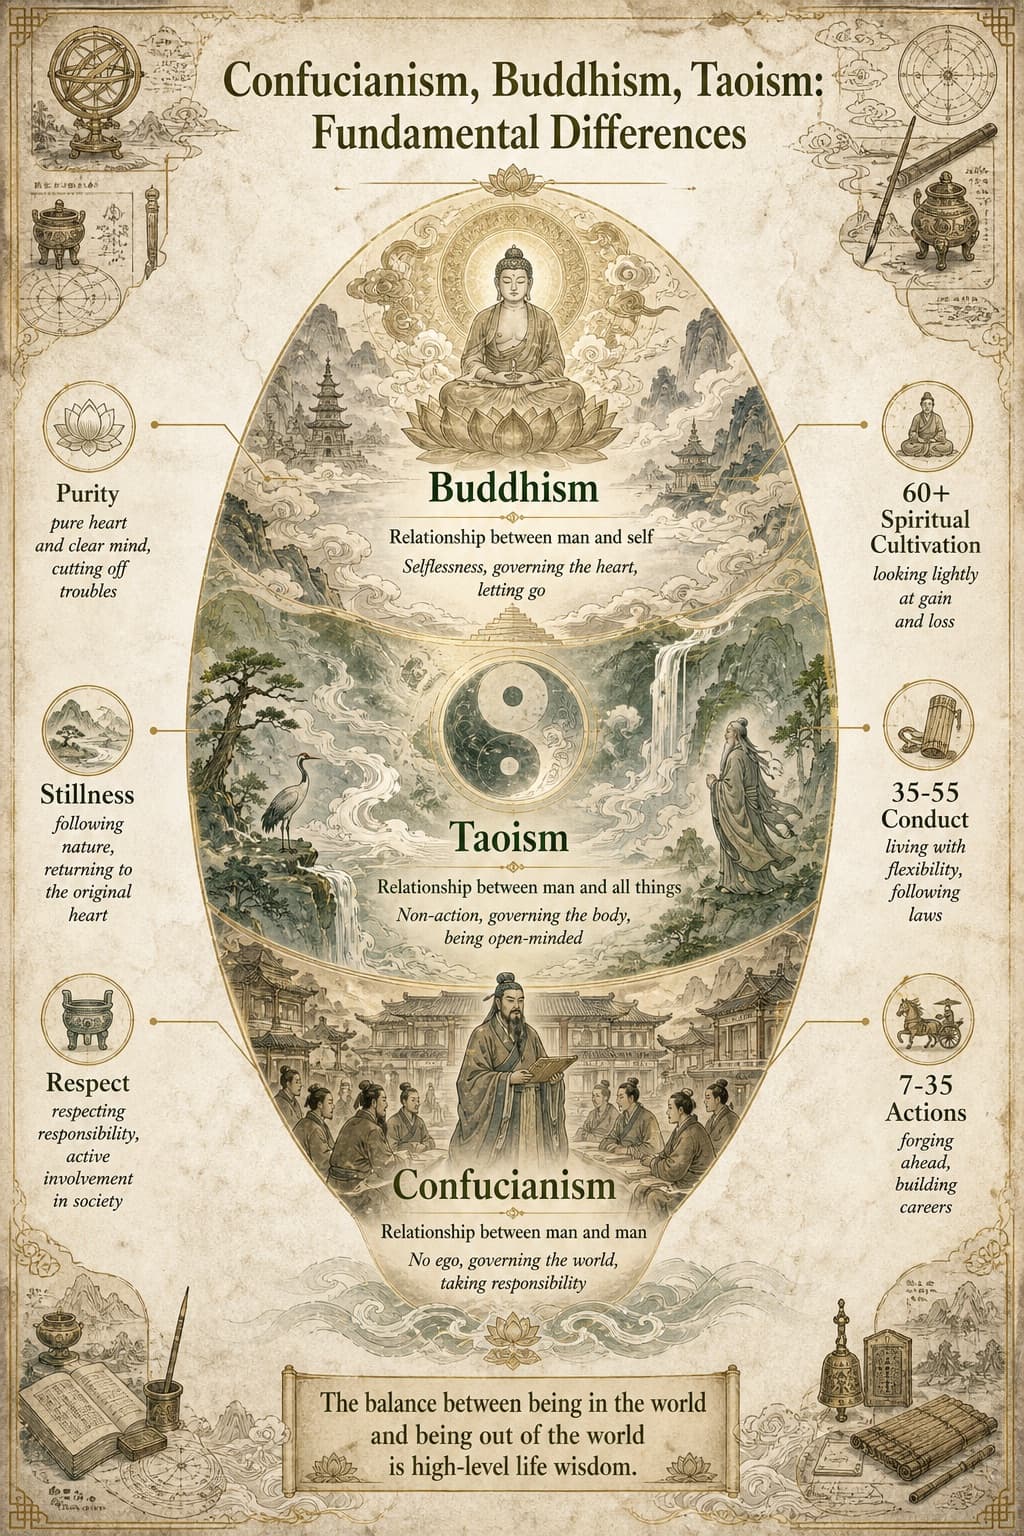
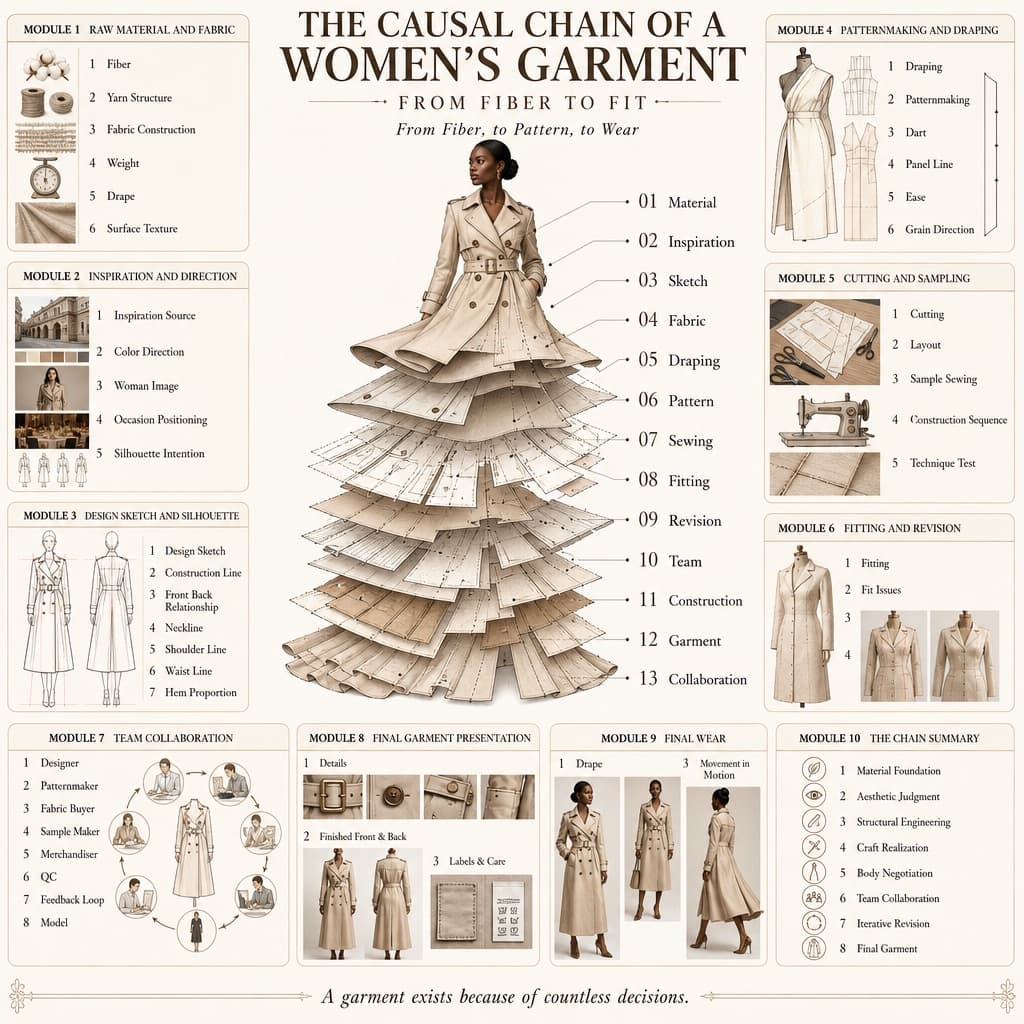
Gout Causal Chain Infographic
A detailed 3D medical infographic mapping the causal chain of gout, from purine metabolism to joint damage and systemic complications.
Budget models do not render typography reliably; this case needs a higher tier.
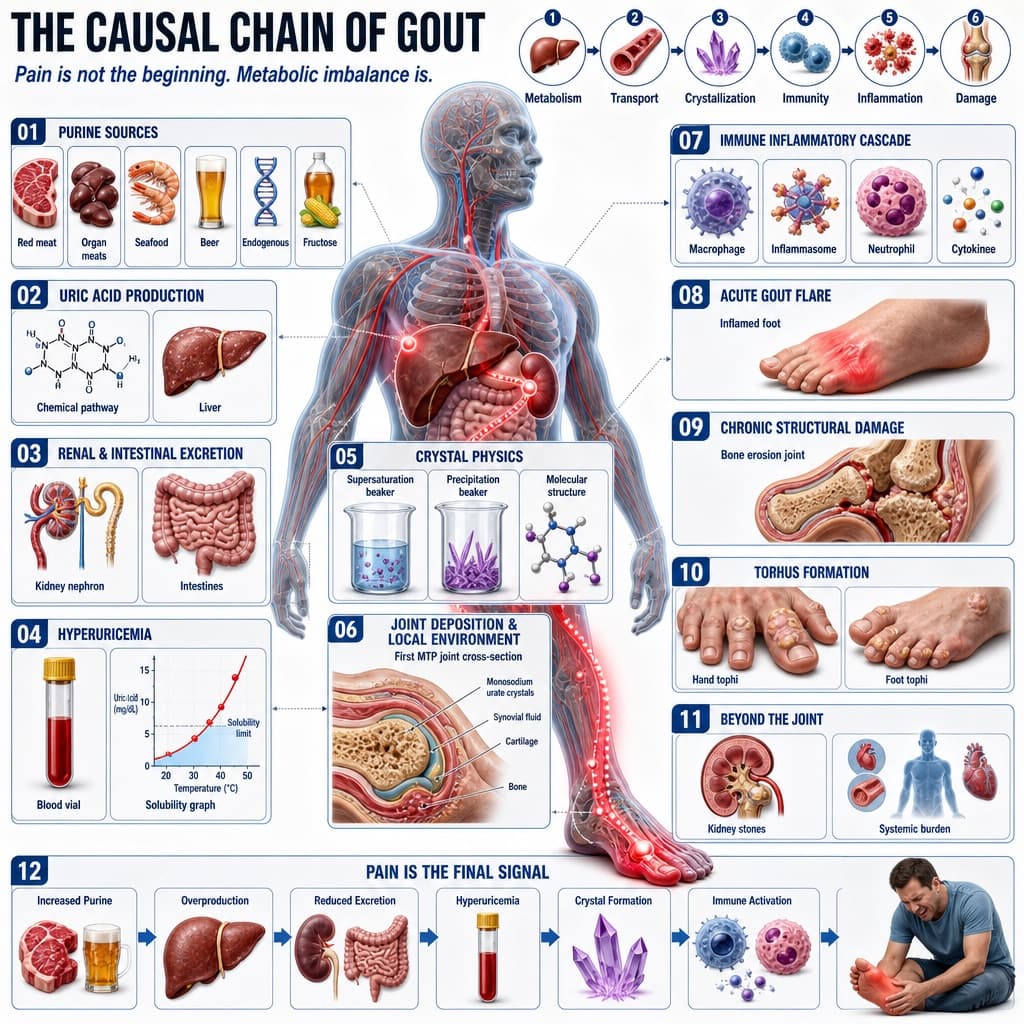
Image generated by us with gpt-image-2. Prompt by @hx831126
Prompt
Create a comprehensive medical infographic in a highly detailed 3D medical illustration style, set against a clean clinical white background with clear, modern typography.

Header: Display the main title '[MAIN_TITLE]' in bold modern sans-serif type, with the subtitle 'Pain is not the beginning. Metabolic imbalance is.' In the top-right corner, show a sequence of six labeled stages: Metabolism, Transport, Crystallization, Immunity, Inflammation, Damage.

Centerpiece: At the center of the composition, depict [CENTRAL_FIGURE], with the pathway highlighted in [HIGHLIGHT_COLOR] descending down toward the foot.

Left column (top to bottom):
01 Purine Sources - six elements labeled Red meat, Organ meats, Seafood, Beer, Endogenous, Fructose.
02 Uric Acid Production - two elements labeled Chemical pathway, Liver.
03 Renal & Intestinal Excretion - two elements labeled Kidney nephron, Intestines.
04 Hyperuricemia - two elements labeled Blood vial, Solubility graph.

Center overlay:
05 Crystal Physics - three elements labeled Supersaturation beaker, Precipitation beaker, Molecular structure.
06 Joint Deposition & Local Environment - one element labeled First MTP joint cross-section.

Right column:
07 Immune Inflammatory Cascade - four elements labeled Macrophage, Inflammasome, Neutrophil, Cytokines.
08 Acute Gout Flare - one element labeled Inflamed foot.
09 Chronic Structural Damage - one element labeled Bone erosion joint.
10 Tophus Formation - two elements labeled Hand tophi, Foot tophi.
11 Beyond the Joint - two elements labeled Kidney stones, Systemic burden.

Bottom row:
12 Pain Is the Final Signal - seven elements labeled Increased Purine, Overproduction, Reduced Excretion, Hyperuricemia, Crystal Formation, Immune Activation, Man in pain.

Overall theme of the infographic: [DISEASE_FOCUS].
4 placeholders still empty. Copied as is, the generator will draw the brackets literally inside the image.
Editable variables
Change any value and the prompt rewrites above. Copy the finished result.
English translation of the main title shown below the Chinese title in the header.
Description of the anatomical centerpiece figure shown at the middle of the infographic.
Color used to highlight the physiological pathway on the central figure.
The medical condition or physiological process that is the overall theme of the infographic.
Generate the image here
With your own OpenAI key. Free for us, and what you spend is yours.
Kept in this browser only and sent straight to OpenAI's API: it never passes through a server of ours, because there is no server of ours in between. Check it yourself in the network tab.
Fill in the remaining variables before generating, or the model will draw the brackets.